User login
Language
Anonymous's groups in this site
User is not a member of any group.
Your groups across all your sites
User is not a member of any group.
Recent Content
Who's online
There are currently 0 users online.
You are here
Southeast Florida Regional Climate Change Compact Provides Update to Regional Sea Level Rise Projection
Primary tabs
submitted by Jan Booher
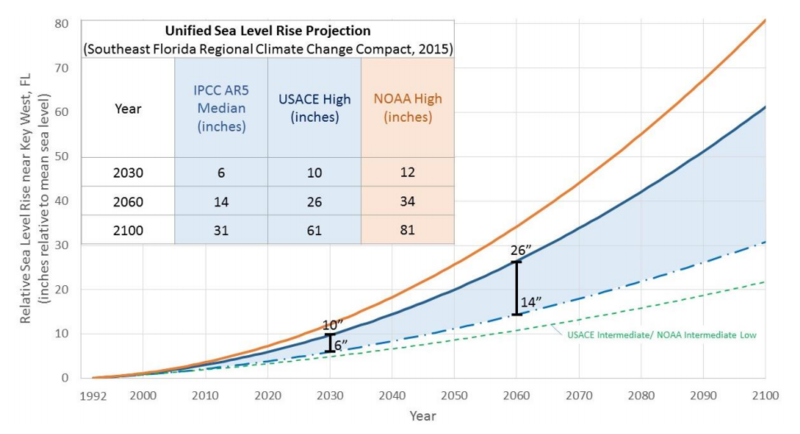
Figure 1: Unified Sea Level Rise Projection. These projections are referenced to mean sea level at the Key West tide gauge. The projection includes three global curves adapted for regional application: the median of the IPCC AR5 RCP8.5 scenario as the lowest boundary (blue dashed curve), the USACE High curve as the upper boundary for the short term for use until 2060 (solid blue line), and the NOAA High curve as the uppermost boundary for medium and long term use (orange solid curve). The incorporated table lists the projection values at years 2030, 2060 and 2100. The USACE Intermediate or NOAA Intermediate Low curve is displayed on the figure for reference (green dashed curve). This scenario would require significant reductions in greenhouse gas emissions in order to be plausible and does not reflect current emissions trends.
southeastfloridaclimatecompact.org - Prepared by the Sea Level Rise Work Group - October 2015
Recommendations will inform flood control and infrastructure planning
Partners in the four-county Southeast Florida Regional Climate Change Compact (Compact) have prepared an update to the regional sea level rise projection used for important planning purposes in accordance with the technical recommendations of the Compact’s Sea Level Rise Work Group. The update shows slight increases in short-term projections, but more significant increases long-term in the absence of dramatic greenhouse gas emissions reductions.
(CLICK HERE - READ COMPLETE ARTICLE)


Recent Comments