User login
Language
Anonymous's groups in this site
User is not a member of any group.
Your groups across all your sites
User is not a member of any group.
Recent Content
Who's online
There are currently 0 users online.
You are here
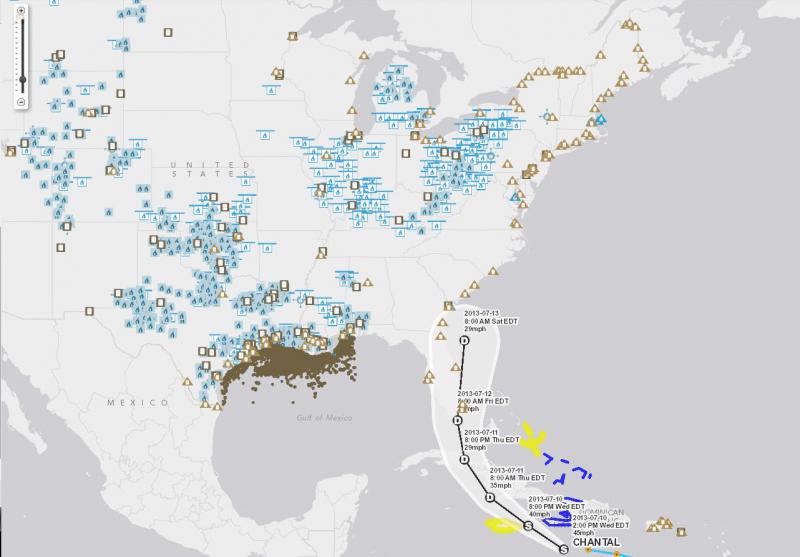
Map Mashes Hurricane Information with Energy Infrastructure Data
Primary tabs
(FOR THE INTERACTIVE MAP - CLICK ON MAP IMAGE BELOW)
emergencymgmt.com - by Sarah Rich - July 11, 2013
This year's hurricane season may prove a bit different for the energy sector, thanks to a newly updated interactive map, pictured (above), made available by the U.S. Energy Information Administration (EIA).
What was an existing state map launched by the agency last September now includes more than 20 layers of GIS data to plot the nation’s energy infrastructure and resources. The data can be mashed up with real-time tropical storm and hurricane information from the National Hurricane Center, so resources like offshore production rigs, pipelines, coastal refineries power plants, and energy import and exports sites can be monitored as the severe weather occurs, according to the EIA.
(ORIGINAL SOURCE - GOVERNMENT TECHNOLOGY)
CLICK HERE - U.S. ENERGY INFORMATION ADMINISTRATION (EIA) - INTERACTIVE MAP


Recent Comments